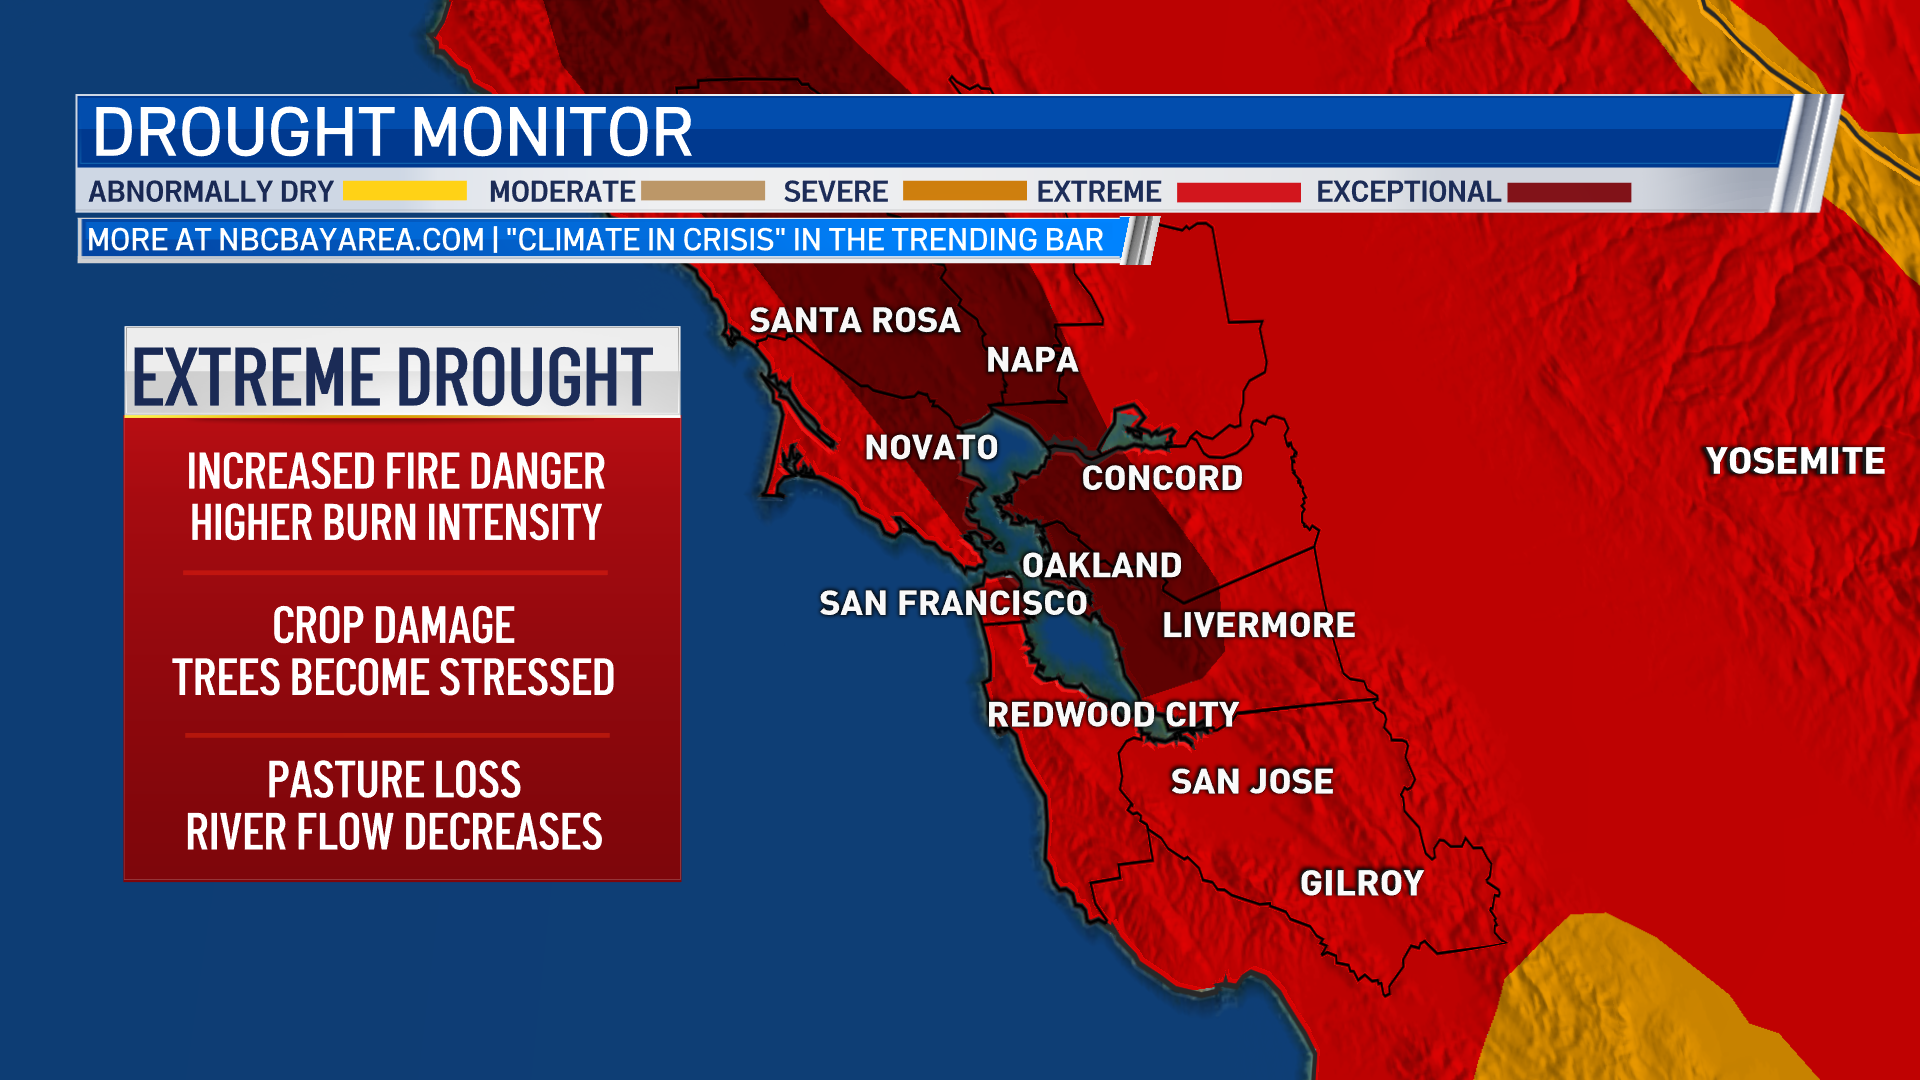
The new drought data is out and you can see it continues to grow with 15.91% of California now in “exceptional drought." The maps below also show this exceptional drought level now includes portions of the Bay Area. Look for the darker red color on the map and you’ll see it’s the worst over the North and East Bay.


As the drought continues to grow we wanted to put a few numbers into perspective for you. The image below shows most of Northern California is in the orange to red color. That represents 40 to 52 weeks in 2020 when we had drought conditions. So, you may not have realized it last year but we had some sort of drought for about the entire year of 2020. The drought is also now the most widespread across the United States since 2013 with a cost that hovers near $9 billion for each drought event (data since 1980). This is the 2nd highest weather disaster cost. Coming in at the top is tropical activity – hurricanes averaging $19 billion.
Get a weekly recap of the latest San Francisco Bay Area housing news. Sign up for NBC Bay Area’s Housing Deconstructed newsletter.

You can find out more about how the Bay Area climate is changing in a series of stories the Microclimate Weather Team worked on across the Bay Area.


