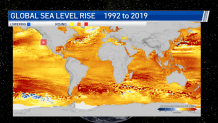
When we hear about our changing climate we often hear about rising sea levels, but where exactly is it rising? Check out this map and you can see from 1992 to 2019 all of the areas in yellow, orange and red that represent rising sea levels. This is happening for most of the global ocean regions. There’s just a few spots in the blue color showing dropping sea levels.

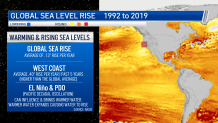
New data shows the global sea level is rising on average 0.13 inches. Notice how the West Coast the past five years is rising on average 0.40 inches per year. That is faster than the global average. There are some factors that can influence the West Coast sea level rise, like El Niño and the PDO (Pacific Decadal Oscillation). These patterns can bring warmer water temperatures. Warmer water expands and causes water to rise.

Get a weekly recap of the latest San Francisco Bay Area housing news. Sign up for NBC Bay Area’s Housing Deconstructed newsletter.
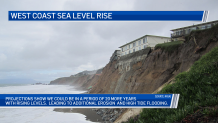
So, what does all of this mean for the West Coast? Projections show we could be in for a period of 20 or more years with rising levels. This would lead to additional erosion and high tide flooding.


