After California's dismal showing over the summer's primary elections, a lot of people predicted a terrible turnout for the midterm elections. A Field poll forecasted record low turnouts this year.
Right now, the Secretary of State's website is recording a voter turnout of 29.9 percent. No doubt about it, that's a devastatingly low number. But here's why it's not quite as bad as it looks.
First of all, these results are preliminary and there are a few absentee ballots that need to be counted. Second, there's lots of ways to count voter turnout. A lot of people compare the number of ballots received to the voting-age population. That's called a "VAP" number. Right now, the Secretary of State's website is simply dividing the number of ballots from each county from the number of registered voters in that county.
A much beter way to think about voter turnout is to compare the number of ballots with the Voting Eligible Population, or VEP. That excludes our rising felon population, along with others that for one reason or another might be of age, but are not eligible to vote.
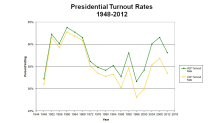
The United States Election Project thinks that bad accounting is responsible for a lot of the rhetoric around voter turnout. If you use the VEP number, voter turnout in the US is actually better than it was in, say, the mid 1990s:

Using these numbers, California's historical voter turnout is roughly on par with the national average:
Local
It's widely known that turnout in midterm elections is bad in general. So far, California's kept up with the ups and downs of the national trends.
Yet, the state could certainly do better. This year was certainly a down year and current estimates show California's 2014 turnout at 34.8 percent. That's less than 2 points below the national average of 36.6 percent, but it's more than 10 points below the last midterm election when the California netted a turnout of 45.8 percent.
So who's to blame? US News and World Report points out that the young aren't carrying their weight: exit polls showed that only 13 percent of voters were under 30. Also, non-whites make up a disproportionately large amount of the non-voters, according to these Pew statistics.
For perhaps these reasons, voter turnout tends to be lower in denser, more urban counties. In the map below check out the small dark circles in the northern counties where population is low but turnout is high. Those big pale circles around the Bay Area and Los Angeles County are showing some of the lowest turnouts, some well under 30 percent.


