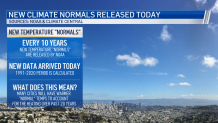
New data released Tuesday continues to show we are warming.
Every 10 years NOAA calculates the new climate - temperature “normal” for cities across the United States and this was just completed for the period of 1991-2020 (30 years of data is typical). So what does this mean? Based on the new data many cities will have warmer “normal” temperatures.
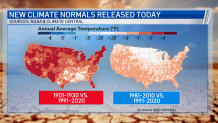
You can see in the image below when you compare the record period of 1981-2010 vs. 1991-2020 many cities have warmed on average .5° to 1°. Also, take a look at 1901-1930 vs. 1991-2020 and the heating story is much bigger for this period with much of the west warming 2°to 3° on average.
Get a weekly recap of the latest San Francisco Bay Area housing news. Sign up for NBC Bay Area’s Housing Deconstructed newsletter.
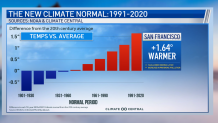
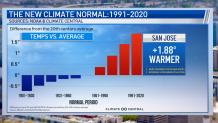
But what does that mean for the Bay Area? Check out San Francisco below and you can see we have warmed 1.64° when you compare our temperature to the 20th century average. San Jose has also warmed 1.88°.
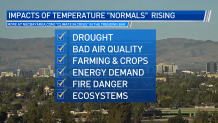
While 1-2° of warming doesn’t sound like much it does set off big impacts that we are already experiencing like drought, bad air quality, changes to farming, energy demand, fire danger and our ecosystems.
You can find out more about how the Bay Area climate is changing in a series of stories the Microclimate Weather Team worked on across the Bay Area.


